
Recently, ICICI Prudential has come up with the NFO for their new Index fund mimicking the US based Nasdaq composite Index. The media has been buzzing and the number of articles about why you should invest in the fund are available in abundance. This is probably the 3rd or 4th fund which enables the Indian investor to take exposure to Nasdaq Index [Other options are via Motilal Oswal & Kotak AMCs]. To save time of mine as well as yours, I’m not going to talk about what this fund is all about & it’s benefits. You can refer to the literature produced by the AMC in their presentation[Link]. We will try to discuss few specific points, that should enable you to decide, if you should add this fund in your portfolio or not. The fund is quite attractive from the perspective of potential ownership of the Big Tech names and next gen Innovative companies. Though as usual, I can not predict the future but I can look for the longer historical track record to make some reasonable expectations. We will try to look through the lenses of Risk & Return and it’s benefit to overall portfolio.
Caveats: Before we jump into the detailed numbers/ charts, Let’s understand that data I used is from the google finance for Nifty 50 Index, Nasdaq 100 index and Currency values. As the market operations differ in both countries, I tried to take the base as Nifty 50 & everything is calculated in the INR terms. The dividends are not included as it’s not the TRI data.
Let’s talk about returns first, I would use the rolling returns data and not the point to point returns as most of the articles and presentations are sharing. I am also going to look thorough the returns for a longer time horizon, Since Jan 2000 to Today a good 20+ years of history. One thing that flags from that analysis is that the last decade has been dominated by Nasdaq vs Nifty 50, though 2000-2010 has Nifty as a winner. Both these returns are in INR terms and do not include impact of Dividends. Overall If we take the Geometric mean of all the 1year rolling returns, Nifty takes the lead with 11% vs 8.6% of Nasdaq. Therefore, If the recent outperformance of Nasdaq is luring you to this fund beware of the lure. Please note that this is based on historic data so we do not know if this would hold true for Future or not.
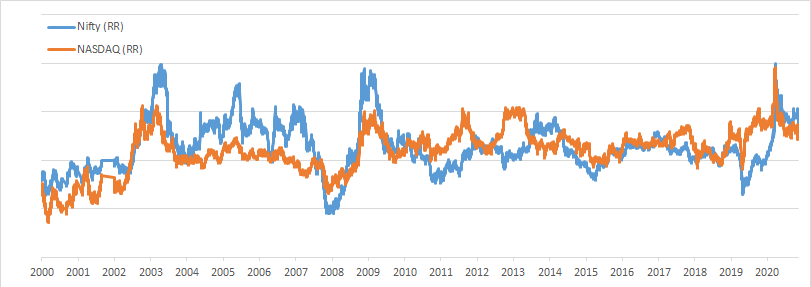
In terms of risk, The returns of Nifty as well as Nasdaq has been quite volatile. Nifty returns have ranged between +99.4% to -55.5% vs the Nasdaq returns range of +95.5% to -64.3%. In terms of Max drawdown during the analyze period, Nifty had the worst drawdown of -59.4% vs -75.5% for the Nasdaq. Yes, That’s correct the Nasdaq had lost 3/4th of It’s value during the Tech bubble burst in 2000-01 period. In terms of Standard deviation, Nasdaq is slightly better off with 21.9% vs 25.6% of Nifty. Based on these data points, Nasdaq is less volatile but has higher drawdowns & swings to negative.
This does not make a great case for investment in Nasdaq 100 index as the mean returns are lower and risk parameters are comparable if not worse. Though we should not stop here on our decision, As I flagged in my article on Modern Portfolio Theory even if the standalone assets are risky the combination might have the diversification benefits. For e.g. I made the case to have gold in your portfolio for diversification benefit. In 2020, when markets had large drawdowns the rally in gold has cushioned my portfolio a lot and gave me confidence to deploy more money in equities at that opportune time.
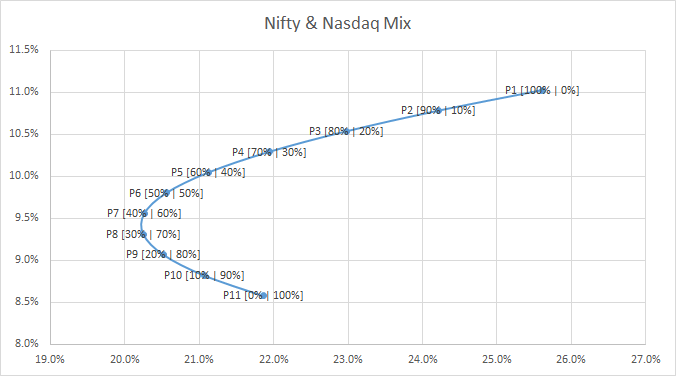
I am in awe of the above chart as it’s shape matches with the efficient frontier we have learnt during academic years. replicating something similar with real data & example is a great experience 🙂.
In the above chart, I have plotted 11 portfolio combinations, P1 is 100% Nifty to P11 is 100% Nasdaq. As you move across the Portfolios, you would notice that we would keep on reducing the volatility with increasing mix to Nasdaq and sacrifice some returns in process. This characteristic appears due to lower correlation (approx. 0.5) between these indexes rolling returns over the analyzed period. P4 (70% Nifty : 30% Nasdaq) has a similar volatility to Nasdaq index but adds +180bps on the returns, This means the investors should have higher exposure to Nifty to get a better risk adjusted returns. In real life, the correlations are not constant but dynamic and the realized benefit might be lower than expected as per the above chart.
Based on the above data points, I would say that Nasdaq is a risky proposition as an individual investment with higher drawdowns & lower mean returns for Indian retail investors like me & you . It definitely provides the diversification benefits but that would need an exposure of 20%+, If you plan to invest couple of % points or say 5-10% then you can give it a skip. We might be better off with taking global diversification using other options like S&P 500 or Developed world Index funds, though I have not analyzed so not recommending that yet.
Don’t jump on all the NFOs hitting the market, Follow the broad thoughtful portfolio which needs less changes to be a successful investor over a long term. Happy Investing!
If you find the above information & analysis useful, Do like, subscribe and share the article with your friends. Write to us, if you want me to analyze any particular scenario & facilitate decision making based on the data.
