
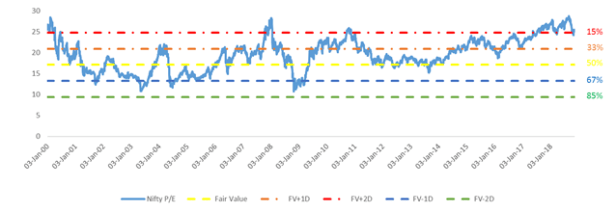
As I mentioned earlier, it does not make sense to have constant asset allocation in your portfolio because if the market valuations are in a high territory, there is limited upside while chance of downside are much more. To prove this hypothesis of mine, I looked at the data starting from Jan 2000. I took the historical PE data easily available and does not have any forecasting bias of earnings growth. Map it with the 1 year rolling return looking forward. When I look for returns for these 18 years worth of data; In the Top zone of PE there is 66% probability that you will have a -ve 1 yr forward return, while in the bottom zone it is just 2%. Similarly, in terms of average return in the top zone are -16% and in bottom zone are +58%. So, do you agree that it make sense to reduce your equity allocation when valuations are high and increase it when valuations are low.
Before convincing you, further on the dynamic asset allocation vs static asset allocation. Let me try to improve this valuation metrics. Definitely this is not my theory, If you have studied the valuations and equity research you might know about the 3 factor model (Link), If not please read about it. There are similar concept that not only PE ratio should be looked, but also the PB ratios. Now, One can make it more complicated by adding more factors like Dividend yields, Oil prices, Interest rate scenarios or inflation. There is no dearth of variables to play with. Though after making many iterations I realized that the maximum improvement in model happens when I use PE & PB ratios together.
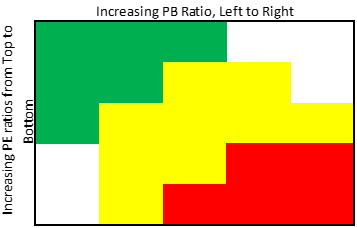
I created the 5×5 metrics of PB ratios & PE ratios ranges and the results were astounding. When markets are trading in High PE & High PB zone, there is 95% chance that you will end up losing money and average 1yr forward return is in range of -30%. Don’t you think we should just avoid equity at that level? Vice versa, If markets are trading in the Low PE & Low PB range there is only 11.5% occurrences of -ve returns and average return has been +37%. Market spends most of the time in yellow zone where it keeps on fluctuating between +ve returns to -ve returns with an upside bias; 63%-times market stayed in this zone, with 26% chance of -ve returns and average return of 12%.
I always bat for asset allocation just not the static one. We will discuss the benefits of the asset allocation in the next week write up. Here is my suggestion, You should not stop your savings and continue the monthly investments just follow the below:
- In green zone, keep 75% equity/ 25% Debt and vice versa in red zone. While in Yellow zone keep it your usual 50-50 asset allocation
- No need to re-balance your portfolio until the market stays in the same zone
- While switching, I can not simulate the chances of exit loads and tax but try to minimize it while re-balancing
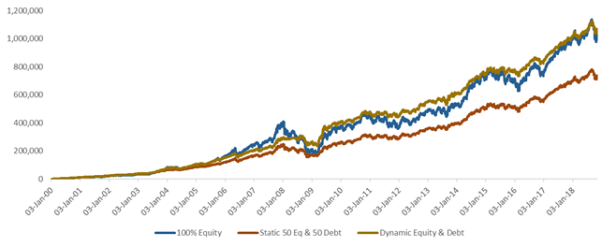
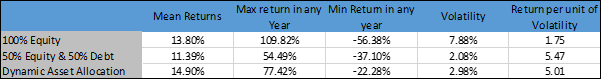
For a 1000 Rs SIP; Invested in 100% equity turns into 10.32Lacs, keeping 50 Equity & 50 Debt will turn the total money of 7.37Lacs and dynamic asset allocation can get you 10.7Lacs. This means that the dynamic asset allocation not only beats your 100% equity allocation but also reducing the down side and increases your risk adjusted returns.
Subscribe to the blog to get the paper with more in detail analysis as well as steps to measure on how to identify the market valuation & its zone.

Hello
Nice article and informative one. Does it mean that investing in dynamic asset allocation fund/ Balanced advantage fund is good choice instead of having different kinds if funds in portfolio?
If you are a new investor and can devote only limited time to manoeuvre your portfolio at your end, Balanced Advantage Funds can be a good choice for decent returns at limited risk/ volatility.
ICICI Pru Balanced Advantage Fund is a great option. Read more on those at https://eduform.in/2018/07/15/balanced-advantage-funds-5-reasons-to-invest/
Thank you for the response. Icici bal adv has very huge AUM. Is any other fund you can suggest
More can be found on the Link I shared for Balanced Advantage Fund
Hi sir, how to identify market valuation and its zones..?
There are three different ways
1. You can use the PE, PB values published by NSE daily to calculate VAluation Index and refer to my article to identify the zone
2. You can refer to ICICIPRU Monthly market outlook for few months to get an idea of valuation zones and it’s values
3. You can look for Motilal Valuation Index to track the valuation zones