
Lot of work on Investing theories has been done over the last century but still basics are not well known to investors. We discussed some basics tenets & applications of Modern Portfolio Theory, Today we will try to understand Capital Asset Pricing Model (CAPM). CAPM provided the first coherent framework for answering the question about expected return, it’s relation with systematic risk (and if there is any Alpha). The CAPM was developed in the early 1960s by William Sharpe, Jack Treynor, John Lintner and Jan Mossin. As per CAPM, the expected return of a portfolio/ security is dependent on two main factors; Time value of money and systematic risk.
E(Rp) = RF + β × (E(RM) – RF)
Time Value of Money is the concept that 100 Rs today are not same as 100 Rs a year from now. We will lose the purchasing power of money and if we can invest the today’s 100 Rs into a risk-free investment we will get some returns, call it risk free return (Rf).
Any rational investor will move their investments from a risk-free investment to risky investment for a risk premium, for e.g. if the equity investments yield higher returns than a risk-free investment then only investors will opt for equity. The market risk premium is defined as the difference between the return of market E(Rm) vs the risk-free return Rf. Though a particular security or portfolio might be more or less risky vs the Market, this is measured as Beta (β). Beta (β) is measured as below:
β = Covariance of (Portfolio & Market) / Variance of Market
“Market beta is assumed to be 1, If the security or portfolio is more volatile/ risky vs the market then the beta will be higher than 1 or else vice-versa.”
Most novice people state that in order to get higher returns, you should take higher risk. They interpret the relationship as higher risk = higher returns. This is where the issue starts, Higher risk only promises higher volatility, which means that the returns will be higher as well as lower than the mean. Investor should confirm and check if the higher risk also translate into a higher mean return.
Also, It should be the aim of an investor to identify the periods of higher returns vs lower returns & adjust the portfolio to decrease or increase the beta of their portfolio accordingly.
Alpha (α) is generated when the return of a portfolio is higher than the risk adjusted expected return of the portfolio using CAPM model. In terms of equation.
Actual Return of Portfolio Rp = Alpha (α) + E(Rp) (i.e. RF + β × (E(RM) – RF))
Let’s take an example of a fund, If the Rf = 5%, Rm = 11% and β = 0.987 then the expected return for the fund as per CAPM will be 10.92% {5% + 0.987 * (11% – 5%)}. In reality if the fund has generated a return of 12%, then we can say that fund has generated the alpha (α) of 1.08% (12% – 10.92%).
“This is important to understand because if you see your portfolio has outperformed the Index by 20%, it does not mean the alpha generated is 20%. Alpha is dependent on the risk portfolio has taken.”
The CAPM theory mainly assumes that:
- Securities markets are very competitive and efficient (All investors have equal access to all available information)
- These markets are dominated by rational, risk-averse investors, who seek to maximize satisfaction from returns on their investments
- Markets are ideal; no transaction fees, taxes, inflation, or short selling restrictions
- All investors can borrow and lend unlimited amounts under a risk-free rate
It is a very good framework to analyse the historical performance of the security or portfolio but as other tools/ frameworks it has its own challenges in predicting the future.
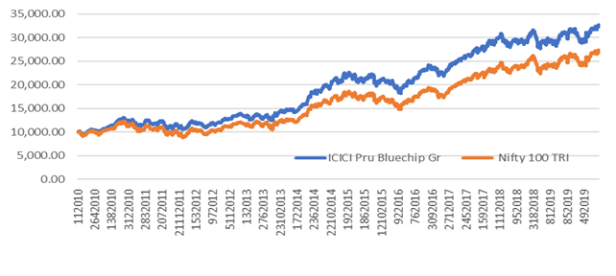
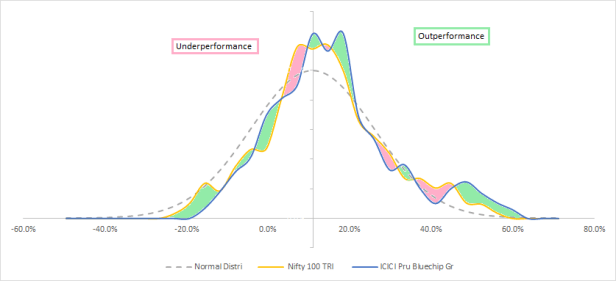
Let’s analyse a Mutual fund using this framework. For this example, I have taken the ICICI Prudential Blue-chip fund & Markets is Nifty 100 TRI. 10 years data taken is from Jan 1, 2010 to Dec 31, 2019. We can see from the below chart that the Fund has outperformed the Nifty 100 TRI, The CAGR of fund has been 12.53% vs 10.52% of the Index. We will try to analyse if this is due to higher risk taken by the fund or it has actually generated an Alpha.
I have calculated the annual rolling returns for every 1-year period to remove the timing impact and smoothen the returns distribution. (rolling returns are calculated as 1yr return calculated for every date. Jan 1 2011 vs Jan 1 2010 is the first value and then you keep calculating the same for each date.) Treasure Bills are taken to get the risk-free return during the period which comes out to be 5.14%. To calculate the below you can use the formulae in excel, which comes out to be 0.987.
β = Covariance of (Portfolio & Market) / Variance of Market
Using CAPM the E(Rp) comes to be 5.14% + 0.987 * (10.52% – 5.14%) = 10.45%, this is lower than the actual CAGR of the fund 12.53%. Therefore, we can say that fund was able to generate the alpha of 2.08%.
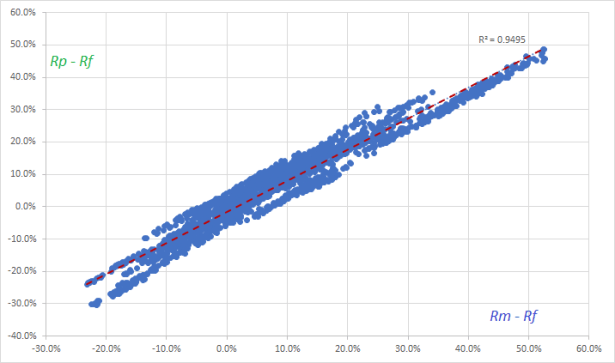
The similar analysis can also be done using the regressing analysis, which also helps us getting the statistical significance. Though before running the analysis we have to adjust the values to have X-axis as (Rm – Rf) and Y-axis as (Rp – Rf).
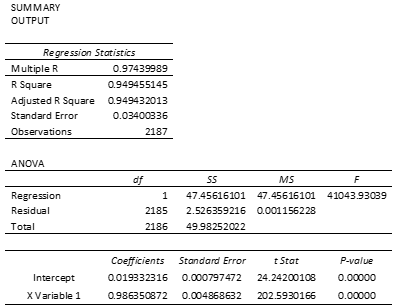
The Output of Regression results will be more or less like below and would have lot many things to understand. Though main variables are:
Multiple R = Correlation between Rp & Rm, 0.974
R Squared = % of accuracy of the model which is roughly 95%
Intercept Coefficients = Alpha 1.93%, It differs from earlier calculations as the Rf varies over the period & regression takes that variation in account
Intercept Coefficients = Beta 0.9863, It differs from earlier calculations as the beta varies over the period & regression takes that variation in account
The best fund will be the one, which can change beta to lower value when markets are expected to correct/decline and increase beta when markets are expected to give positive returns. If we look at the various 1yr Beta for the fund vs Its 1 yr returns. We do not find this happening.
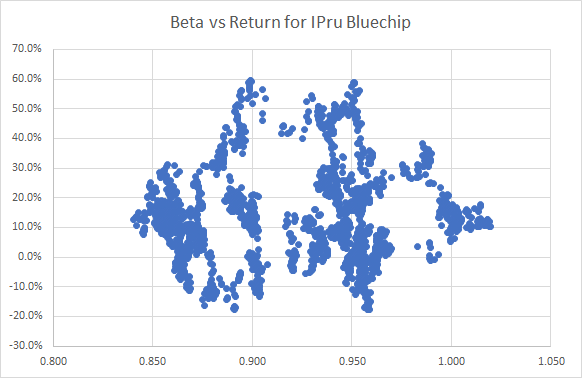
Though the fund has been able to shift the mean return and its distribution to a higher level successfully, which can be attributed probably to either its superior stock selection or sector allocation.
From this analysis, you can determine that your fund has generated the better return due to higher risk or superior stock/ sector selection. If you have a genuine consistent alpha, there is a reasonable chance to happen in future but not a guarantee.
Write to me in case you want to me cover any more such topics or if you have any topics of your interest to learn. Please do like and subscribe.
Happy Investing!

Good analysis