
“If you can learn to create a state of mind that is not affected by the Market’s behavior, The struggle will cease to exist.” – Mark Douglas
Stanley Druckenmiller ran his Hedge fund for 30 years with a CAGR of 30% per year. One of the most impeccable records as an investor, during his career he saw only 5 losing quarters and never a year of loss as per the book The New Market Wizards. This is probably as good as it gets. In the run up of year 1999-2000 for tech stocks, he bought $6bn worth of tech stocks and in six weeks he lost $3bn in that one play. When he was asked about his learnings from this incident he mentioned:
“I didn’t learn anything. I already knew that I wasn’t supposed to do that. I was just an emotional basket case and couldn’t help myself. So maybe I learned not to do it again, but I already knew that.“
He knew that tech stocks were overpriced and probably on crazy valuation so they were ought to correct. He went to short them in 1999, but the tech stocks keep on increasing and he was losing money so he went long on them to close the year in profits. He expected these stocks to correct, but the visual evidence was so contradictory because tech stock prices were still raising and everyone including him was making money. This has created the cognitive dissonance and increased his bet on the tech stocks due to Fear of Missing Out [FO-MO] to regret it later.
After the correction in Feb/Mar 2020, the markets bounced back in Apr & afterwards since then there is an on-going debate that markets are overpriced and the next correction is just down the line. Most people know that the valuations [PE] are at the 99thor 100th percentile but they focus on the story “This time is different” due to central bank policies or fiscal policies or Govt responses etc. On top of it, the near vertical rise of the markets back to the pre-correction level is creating the cognitive dissonance in their heads. As Sir John Templeton has said that “This time is different” are the four most costly words in the annals of investing, should be believe in that story?
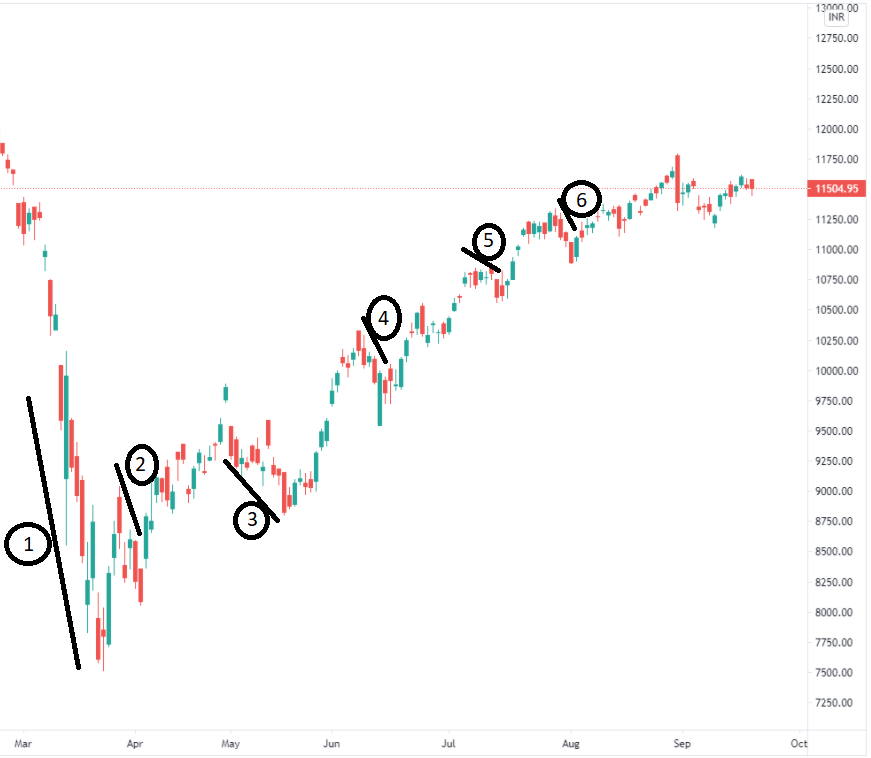
One of the technical chart shared by a friend as above & I found it quite intriguing. I personally do not follow the technical charts for investing but this chart was specially had a message. To those, who have not seen the candlestick chart; the green candles reflect the market has gained on the particular day & red candle represents the correction.
When the market has started to drop in Feb/March [Correction1], lot of people hoarded the cash to deploy at the bottom. In April, When market bounced back by 10-12% Some of the investors got the sense that they have missed out the bottom so in the next Correction2 they deployed the cash. With new cash Market continued their journey upwards & more investors started to fear that they missed the opportunity to invest at the bottom. Therefore, every next correction 3-4-5 saw the new inflow of investors money and market continued its rise. The problem will surface when all the money waiting on sidelines so far is invested back and we reach to the point of last marginal FOMO buyer.
Slowly the cycle will move away from the dominant buyer driven market to seller driven market. When the people will start selling as they do not want to relieve their fear of losing out faced during March 2020. All the weak hands, who have recovered their losses of last correction would start selling more and more of their investments to breakeven or book profits. Markets will start moving down again.
For a long term investor in accumulation phase, I always said that don’t let fear decide your investing decision. If the markets are cheap embrace it and if they are expensive stay on the sidelines. At the end, investing is important and you have more than one asset class to invest in. Don’t be the last marginal FOMO buyer!
P.S.: Simple use of investing rules can take away your emotional biases. Check our section “State of the Play” and subscribe to our blog with email.
